
| # | Athlete | Match pts | Avg % | Gap |
|---|---|---|---|---|
SB Sargon Benjamin |
3,237.4 | 80.69 | ||
 Jacob Heppner |
3,156.6 | 89.88 | ||
JL Jordan Lopez |
2,500.3 | 60.08 | ||
 Austin Aylward |
2,327.4 | 84.57 | ||
DM Deaven Miller |
2,104.7 | 76.35 | ||
ZR Zach Rodman |
2,055.6 | 82.38 | ||
SH Sal Hernandez |
1,987.2 | 86.78 | ||
TP Tyler Patty |
1,867.3 | 70.51 | ||
SW Slade Walding |
1,858.6 | 69.97 | ||
BP Benjamin Pina |
1,812.5 | 67.09 | ||
 Aaron Clark |
1,775.7 | 88.20 | ||
JH Jared Halbert |
1,729.3 | 87.11 | ||
DM David Merritt |
1,421.8 | 74.72 | ||
CA Cody Anderson |
1,417.8 | 70.92 | ||
 Kyle Martin |
1,364.9 | 67.00 | ||
JF Joshua Fox |
1,331.8 | 71.81 | ||
JN Jake Niergarth |
1,311.2 | 69.29 | ||
JW James Woodard |
1,304.6 | 67.39 | ||
AG Anthony Giuliano |
1,296.2 | 63.74 | ||
MG Mike Giaquinto |
1,268.3 | 65.12 | ||
 Willie McLendon |
1,268.2 | 68.34 | ||
JS Jared Stevens |
1,257.8 | 66.01 | ||
NG Nick Gobeli |
1,230.7 | 67.69 | ||
AW Andrew Wold |
1,180.5 | 57.93 | ||
 Timothy Simansky |
1,172.9 | 75.00 | ||
GL George Louzek |
1,160.8 | 62.11 | ||
DO Damon Ortega |
1,123.7 | 60.54 | ||
 Josh Sykes |
1,076.1 | 71.74 | ||
 Chris Brull |
1,055.0 | 70.22 | ||
AA AJ Aponte |
1,045.2 | 72.03 | ||
JW Jimmy Woodard |
1,029.7 | 71.12 | ||
DT David Theriot |
1,025.6 | 68.50 | ||
HP Heath Platt |
613.5 | 41.89 | ||
CC Colton Cunningham |
570.8 | 39.21 | ||
JB Justin BettencourtProv |
794.9 | 66.24 | ||
MS Matt SmithProv |
749.7 | 62.47 | ||
FS Forrest SmithProv |
690.2 | 86.27 | ||
BM Ben MercerProv |
676.6 | 84.57 | ||
JN Jacob NiergarthProv |
643.5 | 85.80 | ||
BP Ben PinaProv |
636.5 | 79.56 | ||
DW Daniel WareProv |
617.2 | 51.44 | ||
 Tory KirklandProv |
616.3 | 88.04 | ||
JF Jake FabriciusProv |
607.5 | 86.78 | ||
JH Jacob HortonProv |
603.6 | 80.48 | ||
CT Christopher TeglasProv |
581.3 | 72.66 | ||
TO Taylor OhlhausenProv |
561.4 | 80.20 | ||
GG Greg GrillotProv |
557.2 | 69.65 | ||
MM Merle McConnellProv |
556.0 | 69.50 | ||
MW Michael WatkinsProv |
554.4 | 46.20 | ||
JH Jon HatcherProv |
534.1 | 71.21 | ||
DS Derek SatterfieldProv |
528.4 | 70.45 | ||
SN Shawn NelsonProv |
509.7 | 67.96 | ||
MG Matthew GreeneProv |
504.1 | 72.01 | ||
ZR Zach RushProv |
502.6 | 62.82 | ||
CG Chris GillespieProv |
496.0 | 62.00 | ||
NA Nate AyersProv |
495.0 | 70.72 | ||
RS Rylan SchadeggProv |
494.8 | 61.85 | ||
DF Derek FrenchProv |
491.5 | 61.44 | ||
CM Chase MitchellProv |
489.0 | 69.85 | ||
CP Chris PearsonProv |
486.7 | 64.89 | ||
MM Michael McCuneProv |
482.3 | 64.30 | ||
DH Danny HawkinsProv |
479.2 | 63.90 | ||
KC Kevin CummoProv |
470.5 | 67.22 | ||
MA Michael AavangProv |
453.1 | 64.73 | ||
TE Tyler EngProv |
446.6 | 59.54 | ||
TS Tanner StarnesProv |
443.9 | 59.19 | ||
DM Derek MickleProv |
441.3 | 63.04 | ||
JF Jeremy FernandezProv |
440.0 | 62.86 | ||
 Wil HilderbrandProv |
432.1 | 61.72 | ||
JL John LockeProv |
419.7 | 55.97 | ||
MM Matt MurrayProv |
402.1 | 53.61 | ||
MA Matthew AikinProv |
400.1 | 50.01 | ||
GP Gregory PrahlProv |
396.8 | 49.60 | ||
MH Matthew HorneProv |
391.4 | 52.19 | ||
KH Kristopher HaleProv |
375.4 | 50.06 | ||
DB Dylan BralyProv |
371.0 | 46.37 | ||
MM Mario MartinezProv |
334.6 | 47.80 | ||
SV Sam VallinProv |
325.9 | 40.73 | ||
JK Josh KinneyProv |
325.0 | 40.62 | ||
AA Andrew AguilarProv |
248.7 | 31.08 |
| # | Athlete | Match pts | Avg % | Gap |
|---|---|---|---|---|
 Ehea Schuerch |
3,204.5 | 91.59 | ||
MK Megan Kennedy |
2,971.6 | 86.38 | ||
 Blayr Drumm |
2,752.4 | 78.67 | ||
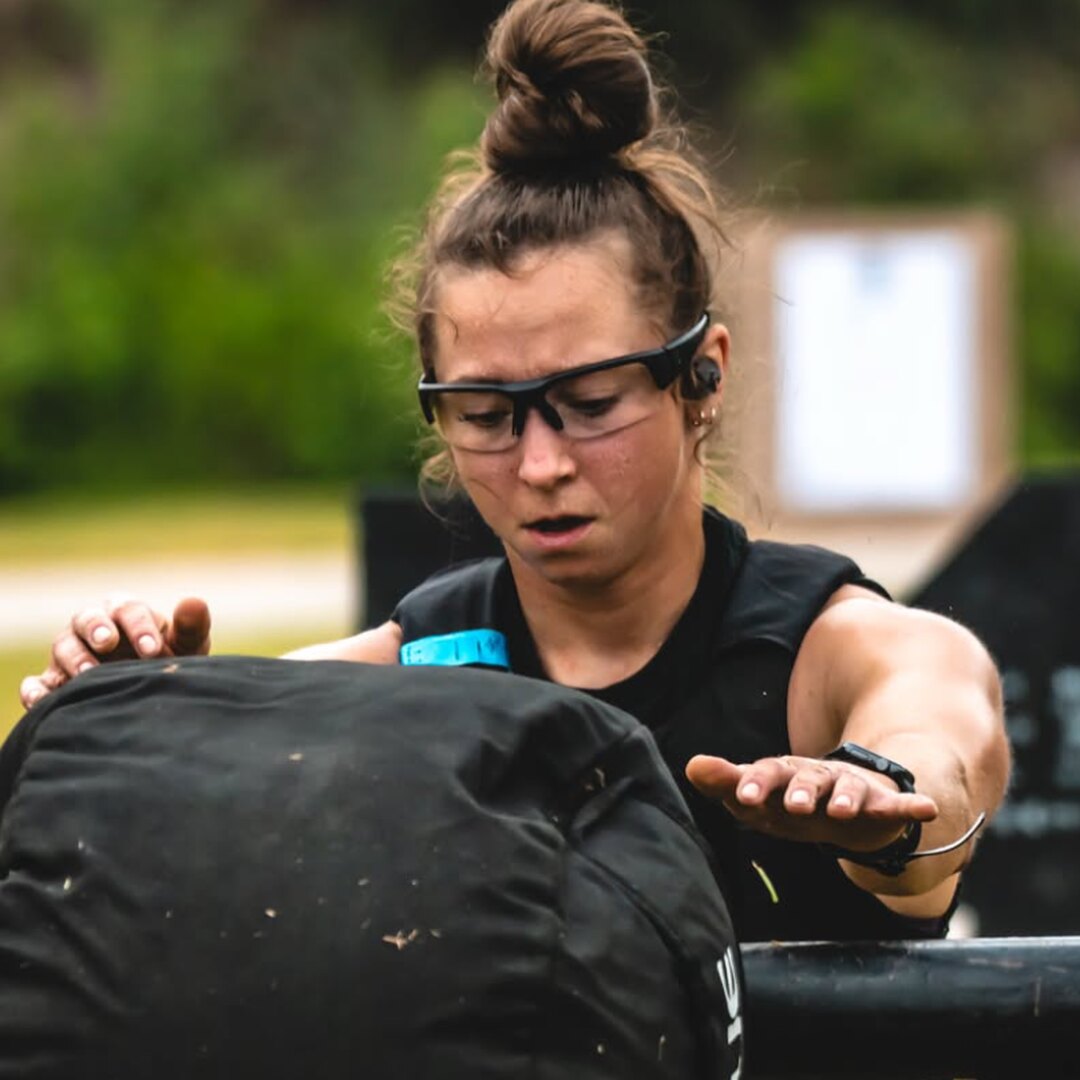 Jenay DeCaussin |
2,540.0 | 93.76 | ||
 Crystal Herber |
2,037.6 | 79.85 | ||
LD Lexy Dickenson |
2,003.1 | 73.21 | ||
LH Lupe Hernandez |
1,947.0 | 84.91 | ||
JG Jennifer Gerasimos |
1,923.5 | 70.34 | ||
KP Kristin Pollard |
1,783.3 | 70.14 | ||
TB Tristin Burris |
1,410.1 | 94.00 | ||
MP Mallory Pettas |
1,311.0 | 87.92 | ||
JH Jay Hazelett |
1,203.4 | 80.23 | ||
 Kristie Watson |
1,188.9 | 76.79 | ||
TC Trish Crochet |
1,182.2 | 64.12 | ||
AH Amy Holt |
1,151.7 | 77.39 | ||
CK Chelsea kling |
1,056.4 | 52.69 | ||
SH Sarah Harrison |
1,015.4 | 67.83 | ||
JS Jade Savage |
988.0 | 67.11 | ||
CC Corinna CoffinProv |
659.9 | 87.99 | ||
BT Becca TroullietProv |
638.3 | 79.79 | ||
 Andrea HilderbrandProv |
597.1 | 79.61 | ||
CK Christene R KnightProv |
553.3 | 46.10 | ||
AD Alexandra DickensonProv |
542.6 | 67.82 | ||
BU Brittany UnderwoodProv |
541.3 | 77.33 | ||
SH Sarah HedgesProv |
532.6 | 66.58 | ||
KR Kris RugloskiProv |
527.1 | 65.89 | ||
CK Callerina KeyProv |
525.1 | 70.01 | ||
CS Carlye ScheerProv |
521.2 | 69.49 | ||
MB Maryanna BarcusProv |
517.0 | 68.93 | ||
KK Katie KnightProv |
515.6 | 68.74 | ||
JB Jessica BaerwolfProv |
433.7 | 54.21 | ||
CK Christene KnightProv |
400.5 | 50.06 |
| # | Athlete | Match pts | Avg % | Gap |
|---|---|---|---|---|
 Joey Roush |
3,021.2 | 82.81 | ||
BG Bo Galarza |
2,100.0 | 82.64 | ||
Wil Hilderbrand |
1,975.5 | 64.98 | ||
JT Jason Taylor-Ohmes |
1,975.4 | 74.43 | ||
 Austin Green |
1,924.6 | 87.43 | ||
ID Ian Davis |
1,887.6 | 82.13 | ||
 Kirt Finnell |
1,715.7 | 92.63 | ||
LS Lou Solonynka |
1,703.7 | 76.00 | ||
LR Landon Rasmussen |
1,551.5 | 81.51 | ||
DG Dillon Grover |
1,547.3 | 81.90 | ||
RS Robert Scott |
1,421.7 | 80.69 | ||
CT Chad Thieman |
1,414.9 | 79.99 | ||
MS Michael Stults |
1,241.5 | 88.68 | ||
SB Samson Bale |
1,220.0 | 76.25 | ||
BM Brett McRaney |
1,213.4 | 80.97 | ||
PM Patrick Mabe |
1,180.9 | 76.14 | ||
JT Jason Temple |
1,164.2 | 72.77 | ||
JL Jacob Lindsey |
1,158.3 | 63.57 | ||
SL Sean Lojek |
1,132.2 | 78.13 | ||
AW Andrew Wold |
1,126.7 | 75.53 | ||
JM Jesse Morkeski |
1,124.5 | 74.97 | ||
JG James Gill |
1,095.4 | 72.94 | ||
RF Ryan Foley |
1,063.9 | 73.36 | ||
MZ Moe Zahra |
1,028.7 | 64.29 | ||
JD Jeb Davis |
986.2 | 65.74 | ||
JU Jon Urwiler |
872.2 | 58.98 | ||
TK Tom King |
856.9 | 53.56 | ||
AF Adam Framme |
848.8 | 56.58 | ||
ER Edwin Rubio |
838.7 | 52.42 | ||
SR Shamus RyanProv |
815.9 | 74.17 | ||
JH Jacob HortonProv |
806.5 | 73.31 | ||
BP Benjamin PinaProv |
733.0 | 91.63 | ||
SP Stephen PerezProv |
717.8 | 65.26 | ||
Tory KirklandProv |
699.2 | 93.23 | ||
RP Russell PellichinoProv |
681.3 | 85.16 | ||
JK James KirklandProv |
675.1 | 90.01 | ||
CG Chad GrossProv |
671.7 | 83.96 | ||
SJ Spenser JonesProv |
668.5 | 95.51 | ||
BL Brett LawrensonProv |
665.8 | 83.22 | ||
RM Ryan MeadeProv |
664.1 | 88.55 | ||
SL Sergio LopezProv |
652.1 | 59.29 | ||
NS Nathaniel SislerProv |
651.6 | 93.09 | ||
DM Deaven MillerProv |
650.6 | 81.33 | ||
NA Nate AyersProv |
646.9 | 80.87 | ||
MH Matthew HorneProv |
643.1 | 58.47 | ||
CM Caleb MillerProv |
641.4 | 80.18 | ||
IC Ivan CortesProv |
640.8 | 85.43 | ||
PC Patrick CourtProv |
639.5 | 79.94 | ||
DJ Dylan JoffrionProv |
635.8 | 79.47 | ||
 Daniel BesteProv |
632.5 | 84.34 | ||
MA Matt AmmelProv |
629.0 | 83.86 | ||
AH Andrew HarrisonProv |
624.4 | 78.05 | ||
WO Walker O'sullivanProv |
624.3 | 78.04 | ||
TC Taylor CourtProv |
620.4 | 82.72 | ||
SS Sean SmithProv |
620.3 | 77.54 | ||
JC Jordan ChovanecProv |
614.3 | 81.91 | ||
SH Seth HarlowProv |
612.8 | 81.70 | ||
SP Samuel PatrickProv |
606.8 | 75.84 | ||
KS Kyle SaffellProv |
603.3 | 80.45 | ||
RP Ross PolkProv |
602.6 | 80.34 | ||
MB Matthew BarthProv |
600.6 | 85.81 | ||
KD Kevin DubuqueProv |
599.4 | 79.92 | ||
BR Brandon RickardProv |
597.7 | 74.71 | ||
KS Kyle SutherlandProv |
596.3 | 79.51 | ||
NB Nathan BogertProv |
592.2 | 74.03 | ||
CP Cody PierrouProv |
587.0 | 83.86 | ||
SE Shamus EvensonProv |
584.6 | 77.94 | ||
MG Mark GarciaProv |
583.9 | 72.98 | ||
 Nic DinsmoreProv |
583.7 | 77.83 | ||
ID Ian DickensonProv |
579.8 | 72.47 | ||
KW Kevin WexlerProv |
576.5 | 72.06 | ||
DP Dominique PenningtonProv |
575.0 | 82.14 | ||
JB Josh BlankenshipProv |
572.1 | 76.28 | ||
JF Joshua FoxProv |
572.0 | 81.71 | ||
CS Chris SpartichinoProv |
570.6 | 76.09 | ||
OM Owen MendykProv |
568.0 | 81.15 | ||
AN Andrew NewlonProv |
566.9 | 70.87 | ||
EK Eugene KellyProv |
566.7 | 75.56 | ||
RG Richard GrantProv |
564.9 | 75.32 | ||
TP Taylor PalmaffyProv |
561.9 | 80.26 | ||
AO Anthony O'BrienProv |
561.4 | 74.86 | ||
BK Brett KeithProv |
560.1 | 80.02 | ||
ES Eric SalovitchProv |
558.8 | 74.51 | ||
BR Brody RiguesProv |
558.1 | 79.73 | ||
JN Josh NayProv |
557.1 | 69.63 | ||
GL Gordon LiauProv |
556.5 | 69.56 | ||
DP Donovan PadgettProv |
549.6 | 78.51 | ||
SA Sam AbellProv |
548.8 | 73.17 | ||
BR Blake RallProv |
544.5 | 68.06 | ||
TV Trevon VanValkenburgProv |
543.6 | 67.95 | ||
JC Justin ColeProv |
543.6 | 67.95 | ||
ML Mathew LantzProv |
543.5 | 72.47 | ||
DF David FinkProv |
539.4 | 67.42 | ||
GA Greg ArpinProv |
538.7 | 71.82 | ||
BP Brent PelkeyProv |
533.3 | 76.19 | ||
JC Joshua CraftProv |
530.7 | 70.76 | ||
PB Pete BlankenfeldProv |
529.6 | 70.61 | ||
CK Cory KlemashevichProv |
528.2 | 75.45 | ||
KD Ken DeckerProv |
527.4 | 65.93 | ||
SB Sam BurrellProv |
521.1 | 69.48 | ||
SK Stephen KingProv |
520.5 | 69.40 | ||
KS Kevin SingProv |
515.2 | 64.40 | ||
MI Mario IzquierdoProv |
515.0 | 73.57 | ||
JC John CowdenProv |
513.0 | 73.28 | ||
ML Matt LemleyProv |
512.6 | 64.07 | ||
KC Kyle CarnahanProv |
511.7 | 68.22 | ||
AP Anthony PersicoProv |
509.5 | 67.93 | ||
JB James BarnettProv |
504.4 | 72.06 | ||
JT James TheriotProv |
502.5 | 71.78 | ||
JW Jeramie WrightProv |
502.3 | 62.78 | ||
MO Mike OreficeProv |
500.1 | 66.68 | ||
MS Mike SchultzProv |
497.8 | 66.37 | ||
GW Gabe westenProv |
497.0 | 71.00 | ||
AS Addison SchmidtProv |
496.7 | 66.23 | ||
TG Thomas GoldingProv |
491.4 | 70.20 | ||
CN Curt NorrisProv |
490.8 | 61.35 | ||
GS Gregory SchlaffProv |
490.2 | 70.03 | ||
SA Shane AlferProv |
489.6 | 61.20 | ||
KS Keith SummeyProv |
488.6 | 65.15 | ||
RB Ryan ButlerProv |
488.0 | 65.06 | ||
MM Mike McCantsProv |
487.9 | 60.99 | ||
WB Wade BaleProv |
487.9 | 60.98 | ||
MB Matt BryantProv |
487.7 | 65.02 | ||
JY James YeakeyProv |
487.4 | 69.63 | ||
KA Kyle ArringtonProv |
486.4 | 60.80 | ||
MG Mike GrazianoProv |
483.8 | 60.48 | ||
RF Ryan FirminProv |
482.7 | 64.36 | ||
RL Ryan LeBlancProv |
481.8 | 68.83 | ||
GK Garrett KellamsProv |
480.2 | 60.02 | ||
PK Patrick KimballProv |
479.2 | 63.89 | ||
MD Marco DunnProv |
478.0 | 63.73 | ||
JM James MorrisProv |
476.5 | 68.06 | ||
JO Jon ONeillProv |
473.5 | 59.19 | ||
MC Max CarlsonProv |
471.2 | 58.90 | ||
RW Ryan WilliamsProv |
469.7 | 58.71 | ||
AL Alec LivadaProv |
464.2 | 61.89 | ||
MA Michael AdisProv |
463.8 | 61.84 | ||
JM Jesus MaciasProv |
463.3 | 66.19 | ||
AH Aaron HagerProv |
462.8 | 57.84 | ||
AM Austin McAvoyProv |
462.1 | 57.77 | ||
HM Humberto MoralesProv |
461.9 | 61.59 | ||
TR Tyler RhodesProv |
460.9 | 65.84 | ||
BF Brian FieldsProv |
453.4 | 64.78 | ||
JS Joseph SzuchProv |
452.8 | 60.37 | ||
JM Jeff MoghadamProv |
449.9 | 59.99 | ||
JA Joseph AdamoProv |
447.7 | 55.96 | ||
RA Ryder AndrewsProv |
446.6 | 63.81 | ||
ZJ Zeb JensenProv |
446.1 | 55.76 | ||
AB Andrew BryantProv |
445.8 | 59.44 | ||
NC Nathan CosseyProv |
444.7 | 59.30 | ||
RB Ryan BroussardProv |
444.7 | 55.59 | ||
LC Louis CarasProv |
442.9 | 59.06 | ||
RM Reno MayProv |
442.9 | 63.27 | ||
DF David FoleyProv |
441.5 | 63.07 | ||
SH Sam HavelockProv |
439.9 | 58.65 | ||
JM Jordan MaurerProv |
437.8 | 58.37 | ||
MM Michael MillerProv |
436.8 | 58.24 | ||
JW Jay WyattProv |
431.5 | 57.54 | ||
AS Austin SapienzaProv |
428.0 | 57.06 | ||
PK Peter KimProv |
427.5 | 53.43 | ||
JN Jesse NelsonProv |
423.9 | 52.99 | ||
CV Carlos vazquezProv |
423.7 | 52.97 | ||
DJ Daniel JonesProv |
419.5 | 59.93 | ||
JJ Jon JursichProv |
416.7 | 55.56 | ||
JM Jonnethen MiteaProv |
416.3 | 52.03 | ||
DS Dustin SchuldtProv |
412.5 | 55.00 | ||
NL Nathaniel LinvilleProv |
411.5 | 58.79 | ||
JG Joe GloverProv |
411.3 | 54.84 | ||
BT Blake TwiggsProv |
410.3 | 51.29 | ||
JJ JD JacobyProv |
409.2 | 51.15 | ||
AT Andrew TracyProv |
408.8 | 51.11 | ||
EM Ethan MerrittProv |
407.4 | 54.31 | ||
DD Derek DriscollProv |
405.8 | 54.11 | ||
JM John MunozProv |
405.5 | 50.69 | ||
JT Jared TraverProv |
405.4 | 54.05 | ||
DP Dane PopovskiProv |
405.3 | 54.04 | ||
CB Cywettnie BrownProv |
403.5 | 50.43 | ||
SC Sean ConnersProv |
403.2 | 53.76 | ||
TK Tanner KemptonProv |
401.8 | 57.40 | ||
GO Gabriel OlveraProv |
399.1 | 57.02 | ||
II Ikiyoleimoh IyeghaProv |
398.8 | 56.97 | ||
JI Joel Willmott IIProv |
396.3 | 52.84 | ||
PO Patrik OrcuttProv |
396.0 | 52.81 | ||
JK Joshua KepnerProv |
385.2 | 51.37 | ||
FC Fred ChevryProv |
382.4 | 47.80 | ||
MJ Mike JagodzinskiProv |
380.8 | 50.78 | ||
JK Jason KrauseProv |
377.6 | 50.34 | ||
JT Joshua ThomasProv |
376.2 | 34.20 | ||
CM Chris MccoyProv |
376.2 | 53.74 | ||
AH Aaron HaireProv |
372.6 | 49.67 | ||
JB Joel BurrowsProv |
367.1 | 48.94 | ||
JB Jeff BreedenProv |
363.9 | 48.52 | ||
DD Derek DepewProv |
356.8 | 47.57 | ||
KD Kyle DavisProv |
349.8 | 43.72 | ||
CM Chancellor MartinProv |
341.9 | 48.84 | ||
EB Emmanuel BrownProv |
340.3 | 42.54 | ||
JK JP KrilProv |
340.3 | 45.37 | ||
JP Justin PattonProv |
333.2 | 44.42 | ||
JM John MulliganProv |
322.6 | 43.01 | ||
JR Jesus RiveraProv |
314.8 | 39.36 | ||
RH Ray HopkinsProv |
298.1 | 37.26 | ||
JN James NasonProv |
272.0 | 36.27 | ||
JG Jay GarciaProv |
263.9 | 37.69 | ||
RP Richard PrudhommeProv |
213.5 | 28.47 | ||
MB Michael BanksProv |
196.3 | 24.54 | ||
RM Robert MontanezProv |
152.7 | 19.09 | ||
CH Christopher HindsProv |
144.8 | 13.16 | ||
RP Rick PrudhommeProv |
117.3 | 15.65 | ||
CT Carlos TavaresProv |
95.2 | 13.61 | ||
RF Richard FontenotProv |
88.0 | 11.00 | ||
SS Skyler SorensenProv |
15.1 | 1.89 | ||
CP Christian PoultonProv |
9.8 | 1.22 |
| # | Athlete | Match pts | Avg % | Gap |
|---|---|---|---|---|
VP Vanessa Price |
2,196.2 | 85.72 | ||
BG Bree Garcia |
1,592.9 | 86.71 | ||
JB Jenna Blackwell |
1,466.2 | 75.19 | ||
KD Katie Durham |
1,459.4 | 81.87 | ||
BR Bryanna Ruddick |
1,318.2 | 87.88 | ||
AS Alyssa Seymour |
1,302.7 | 70.21 | ||
CK Callerina Key |
1,259.6 | 87.02 | ||
KD Kelsey Decker |
1,156.4 | 72.27 | ||
RS Ren Smith |
1,129.1 | 75.36 | ||
GA Grace Allen |
959.4 | 59.96 | ||
 Katie BatisteProv |
997.8 | 90.71 | ||
CC Collyn CurrieProv |
950.3 | 86.39 | ||
KC Kati ColeProv |
791.7 | 98.96 | ||
LH Loraleigh HildProv |
719.0 | 95.87 | ||
AH Amy HoltProv |
714.8 | 64.98 | ||
BT Brittany TownsendProv |
658.1 | 82.27 | ||
AT Ashley TylerProv |
652.3 | 93.18 | ||
NS Nicole StuartProv |
651.1 | 93.02 | ||
KO Kristen OleksikProv |
637.2 | 91.03 | ||
KS Kaitlyn SuterProv |
632.1 | 79.02 | ||
 Mindy HorneProv |
629.3 | 83.91 | ||
TD Taylor DeStefanoProv |
626.8 | 83.58 | ||
CT Cheryl TurnerProv |
616.0 | 82.13 | ||
CT Callie TalleyProv |
615.9 | 76.99 | ||
KT Kristen TricaricoProv |
605.6 | 86.51 | ||
MP Mallory PettasProv |
583.0 | 72.88 | ||
ES Erica ScalavinoProv |
582.6 | 77.67 | ||
JM Jordon MillsProv |
572.3 | 71.53 | ||
TG Tina GarciaProv |
560.9 | 80.13 | ||
MS Mandy StanfordProv |
553.7 | 73.83 | ||
KR Kim Jenkins- RosenthalProv |
507.7 | 72.53 | ||
CH Chelsea HarrisonProv |
507.2 | 72.45 | ||
TM Tram MartinsonProv |
499.6 | 71.37 | ||
MT Mikayla TougasProv |
447.2 | 59.63 | ||
SM Sarah MooneyProv |
441.9 | 58.92 | ||
AL Alyssa LourencoProv |
408.6 | 51.07 | ||
HD Hadassa DaharshProv |
351.9 | 43.99 |
| # | Athlete | Match pts | Avg % | Gap |
|---|---|---|---|---|
 Nathan Drumm |
2,929.0 | 85.28 | ||
CG Clint Gower |
2,275.7 | 85.77 | ||
JD Jason Deal |
2,227.3 | 82.51 | ||
DD Daniel DUKE |
2,074.6 | 82.05 | ||
JH Jeff Hove |
2,050.8 | 76.37 | ||
DL Del LeVasseur |
1,989.6 | 73.53 | ||
HN Havis Nguyen |
1,959.5 | 77.55 | ||
KC Kurt Campbell |
1,943.8 | 72.45 | ||
 Jeremy Cordray |
1,933.1 | 58.48 | ||
JK James Kling |
1,910.6 | 71.05 | ||
PR Paul Rambeau |
1,737.3 | 64.77 | ||
LL Loren Long |
1,695.4 | 65.83 | ||
KH Kirk Holmer |
1,568.0 | 81.47 | ||
 LeEarl Rugland |
1,494.6 | 81.24 | ||
DS Danny Saravane |
1,480.2 | 84.51 | ||
CM Christopher May |
1,456.7 | 63.71 | ||
CH Chris Hoffman |
1,414.0 | 80.51 | ||
ME Matt Elliott |
1,394.4 | 77.82 | ||
JH Jason Hall |
1,347.4 | 72.50 | ||
BL Benjamin LaChapelle |
1,291.7 | 70.50 | ||
JK Jason Keenan |
1,285.8 | 71.24 | ||
JD Jake Davidow |
1,281.7 | 72.34 | ||
SC Steve Chao |
1,198.2 | 66.97 | ||
JE Josh Eggleston |
1,160.4 | 65.07 | ||
JU Jon Urwiler |
1,147.0 | 59.78 | ||
MB Matt Brewer |
1,078.1 | 67.38 | ||
PW Pete Wielebinski |
1,073.3 | 72.52 | ||
KS Kyle Stepp |
1,033.2 | 66.47 | ||
JD Jason Dominger |
990.8 | 68.62 | ||
AM Adam McMahon |
926.0 | 57.88 | ||
CS Chris Scott |
896.6 | 62.09 | ||
MS Michael SaldutteProv |
838.6 | 76.24 | ||
DJ Daniel JirasekProv |
690.2 | 98.60 | ||
TH Tim HorningProv |
664.9 | 83.12 | ||
SL Scott LewisProv |
630.4 | 84.05 | ||
RL Robert LarsenProv |
628.5 | 89.78 | ||
MM May MayProv |
619.9 | 56.36 | ||
BL Brian LeckProv |
600.7 | 80.10 | ||
MG Mark GarciaProv |
596.7 | 79.56 | ||
JC Jamie CroweProv |
591.1 | 84.44 | ||
JW John WhitakerProv |
590.9 | 84.42 | ||
JB Jarred BarnesProv |
589.7 | 84.24 | ||
BW Brandon WellsProv |
576.5 | 82.36 | ||
DK Darin KingProv |
574.6 | 76.62 | ||
DA Darrick AllenProv |
570.2 | 71.27 | ||
SH Star HuynhProv |
566.9 | 80.98 | ||
PB Paul BaughmanProv |
554.3 | 69.29 | ||
MA Martin AndersProv |
544.4 | 68.04 | ||
JW Jeremiah WilberProv |
540.6 | 77.22 | ||
MM Matthew MooreProv |
536.2 | 67.02 | ||
JT James ThorntonProv |
531.4 | 66.43 | ||
RG Ramon GonzalezProv |
530.9 | 66.37 | ||
JS Jason SearsProv |
528.7 | 70.49 | ||
DS Daniel ShawProv |
528.2 | 66.02 | ||
JR Jeff RemsburgProv |
524.4 | 69.93 | ||
RG Ray GonzalezProv |
520.6 | 74.37 | ||
NH Nathan HoltmeyerProv |
519.9 | 69.32 | ||
SM Shane MillerProv |
514.9 | 73.56 | ||
NA Nicholas AmorProv |
507.0 | 67.60 | ||
JT Josh TomsheckProv |
505.1 | 63.14 | ||
JC Jay ChristiansenProv |
503.1 | 71.86 | ||
TM Tony MurphyProv |
501.2 | 66.82 | ||
NW Noah WolfeProv |
488.0 | 65.07 | ||
LA Louis AndersonProv |
482.5 | 60.31 | ||
CD Carl DyerProv |
479.9 | 59.99 | ||
BL Brett LawrensonProv |
477.0 | 59.63 | ||
MC Matthew ColeProv |
463.1 | 66.16 | ||
JB John BurkleProv |
458.2 | 57.27 | ||
MA Matthew AnthonyProv |
449.8 | 64.25 | ||
AP Andrew PeilProv |
449.4 | 56.18 | ||
JH Jason HolmesProv |
440.5 | 58.74 | ||
JS Joel StewartProv |
439.8 | 58.64 | ||
JS Justin StuartProv |
438.1 | 62.58 | ||
RB Richard BaileyProv |
422.0 | 56.27 | ||
AR Ames RondeProv |
415.9 | 37.81 | ||
JC Jeremiah ClemonsProv |
414.9 | 51.86 | ||
TH Thomas HerrinProv |
400.4 | 50.05 | ||
TC Travis ColeProv |
399.4 | 57.06 | ||
TM Tyler MilyardProv |
388.3 | 48.54 | ||
BF Brett FerreiraProv |
365.9 | 45.73 | ||
DP David PearceProv |
362.4 | 45.30 | ||
DS Daniel ScaloProv |
349.7 | 46.63 | ||
WG Walt GonzalesProv |
335.9 | 41.99 | ||
MR Matthew RaslerProv |
299.1 | 37.38 | ||
TW Tanner WarlickProv |
272.7 | 36.36 | ||
RC Richard ConnorProv |
228.9 | 32.69 | ||
JB Jeshua BarnesProv |
225.2 | 32.17 | ||
JW Jeffrey WaytProv |
209.3 | 26.16 | ||
WN William NormanProv |
194.3 | 24.28 | ||
RB Renato BachetProv |
165.4 | 22.05 | ||
AL Andrew LochmannProv |
157.7 | 19.71 | ||
RR Ryan RossProv |
157.5 | 19.68 | ||
HI Hiram Naumu IIIProv |
142.2 | 17.77 | ||
JM Jason McCrayProv |
106.4 | 14.19 | ||
JG Joseph GonzalezProv |
50.0 | 6.25 | ||
TH Tom HerrinProv |
40.0 | 5.00 |
| # | Athlete | Match pts | Avg % | Gap |
|---|---|---|---|---|
BJ Bott, Janelle |
2,107.3 | 0.00 | ||
RK Rodgers, Katie |
1,457.8 | 0.00 | ||
FT Figueroa, Tara |
1,402.9 | 0.00 | ||
WB Willingham, Brandy |
1,070.2 | 0.00 | ||
 Karla HerdzikProv |
979.9 | 89.08 | ||
NS Nicole StuartProv |
919.1 | 83.56 | ||
JB Janelle BottProv |
917.0 | 83.37 | ||
TG Tina GarciaProv |
885.9 | 80.53 | ||
Andrea HilderbrandProv |
884.0 | 80.36 | ||
 Becky WagnerProv |
859.0 | 78.09 | ||
AK Alleia KingProv |
837.5 | 76.14 | ||
KO Kristen OleksikProv |
826.7 | 75.16 | ||
 Tara FigueroaProv |
804.9 | 73.18 | ||
CP Camille PortukalianProv |
765.4 | 69.58 | ||
MJ Mims, JacquelineProv |
747.2 | 0.00 | ||
LA Leslie AllenProv |
714.7 | 64.97 | ||
BW Brandy WillinghamProv |
689.2 | 62.66 | ||
KA King, AlleiaProv |
633.3 | 0.00 | ||
AL Allen, LeslieProv |
587.5 | 0.00 | ||
WR Whiting, RiRiProv |
546.2 | 0.00 | ||
SJ Seals, JenniferProv |
531.5 | 0.00 | ||
HS Halverson, StacieProv |
530.3 | 0.00 | ||
PC Portukalian, CamilleProv |
527.5 | 0.00 | ||
RM Renk, MonikaProv |
396.8 | 0.00 |
| # | Athlete | Match pts | Avg % | Gap |
|---|---|---|---|---|
GF Geoffrey Flattmann |
3,669.8 | 77.11 | ||
EH Edwin Herasymiuk |
2,997.1 | 89.89 | ||
MS Mark Salvador |
2,857.8 | 85.94 | ||
KE Kyle EHRENREICH |
2,565.4 | 77.46 | ||
JP Jason Poindexter |
2,536.0 | 75.82 | ||
JM John Mouret |
2,435.0 | 89.45 | ||
 Brandon Wykoff |
2,193.9 | 84.26 | ||
JK Jason Kohl |
2,093.4 | 62.29 | ||
 Robert Hansen |
2,072.8 | 79.73 | ||
JA Jon St. Arnaud |
2,054.8 | 79.96 | ||
MT Michael Trocino |
1,680.3 | 65.47 | ||
 Jeffery Plaisance |
1,604.8 | 60.98 | ||
DW David Worman |
1,556.9 | 85.99 | ||
SC Steve Carney |
1,539.4 | 59.08 | ||
JA Jeff “Patch” Adams |
1,460.3 | 63.78 | ||
 Dirk Vice |
1,451.7 | 81.34 | ||
TD Tom Dowdy |
1,374.8 | 78.96 | ||
JZ James Zhang |
1,370.2 | 78.53 | ||
SS Scott Stephens |
1,268.6 | 71.03 | ||
MG Mike Griswold |
1,254.5 | 70.42 | ||
KM Kirk McIntosh |
1,232.4 | 67.78 | ||
BG Bob Gawler |
1,232.2 | 67.89 | ||
CG Craig Griswold |
1,219.1 | 68.24 | ||
BH Bobby Herron |
1,193.0 | 82.40 | ||
 Bill Corcoran |
1,168.8 | 77.80 | ||
AM Arturo Morales |
1,138.3 | 63.12 | ||
GM Greg McKinney |
1,113.6 | 76.72 | ||
MO Marvin Ong |
1,011.8 | 65.21 | ||
RH Richard Hill |
941.4 | 58.84 | ||
JL Jeff Lischka |
870.1 | 55.81 | ||
BP Bob Porzio |
777.3 | 48.58 | ||
JW James Weialnd |
767.0 | 47.94 | ||
MR Miguel Rebello |
760.8 | 51.86 | ||
MR Matthew Roman |
752.7 | 47.05 | ||
DP Dario Perez |
703.3 | 43.63 | ||
LS Lou SolonynkaProv |
936.2 | 85.11 | ||
ER Ed RussmanProv |
794.9 | 99.36 | ||
JS jonathan SturgisProv |
688.8 | 86.09 | ||
DH Dan HachenbergerProv |
650.6 | 81.32 | ||
WC William CorcoranProv |
635.5 | 57.78 | ||
TT Thad TrappProv |
632.5 | 84.34 | ||
GP Glenn PosikProv |
620.0 | 88.57 | ||
ST Scott R TaylorProv |
619.7 | 77.46 | ||
CM Chris MolineProv |
615.6 | 82.08 | ||
EW Edward WheelerProv |
610.3 | 81.37 | ||
BR Bo RisticProv |
577.5 | 72.19 | ||
MP Mark PriceProv |
568.8 | 75.84 | ||
SL Shawn LattaProv |
563.0 | 80.43 | ||
NM Napoleon MagpantayProv |
557.1 | 74.28 | ||
KM Kevin McAdamsProv |
553.5 | 79.07 | ||
CD Chris DiCensoProv |
551.0 | 73.47 | ||
JF Jordan FlandersProv |
545.1 | 72.68 | ||
MK Matt KarresProv |
535.6 | 71.41 | ||
SR Steven RaubeProv |
530.6 | 70.74 | ||
GH Greg HavlikProv |
526.3 | 70.17 | ||
GS Gary SchallProv |
524.9 | 74.99 | ||
BS Benjamin SudaProv |
524.0 | 69.87 | ||
DK Davin KeithProv |
522.9 | 74.70 | ||
KH Keith HairProv |
522.0 | 69.60 | ||
AM Art MoralesProv |
497.5 | 62.18 | ||
CW Christian WilliamsProv |
496.0 | 66.13 | ||
MP Mark PaganProv |
495.5 | 66.07 | ||
PF Peter FrolishProv |
493.9 | 65.86 | ||
WP Will PriceProv |
490.3 | 70.04 | ||
EH Eric HenricksonProv |
482.0 | 68.86 | ||
DZ Dennis ZawillaProv |
481.0 | 64.13 | ||
KP Kent PerrierProv |
468.5 | 58.56 | ||
DH David HilfProv |
451.3 | 60.17 | ||
DM David McCraneProv |
451.2 | 60.15 | ||
DR David RoseProv |
444.0 | 59.20 | ||
JM James McGrathProv |
438.8 | 58.50 | ||
MG Michael GawneProv |
437.9 | 62.55 | ||
DR Derek RuffinProv |
433.6 | 61.94 | ||
DT David TwinamProv |
429.9 | 61.41 | ||
CD Craig DavisProv |
418.9 | 59.84 | ||
CD Curtis DunnProv |
415.1 | 55.35 | ||
CD CARLOS DavilaProv |
414.6 | 51.83 | ||
QM Quincy McNeeleyProv |
414.2 | 51.77 | ||
PN Patrick NuanezProv |
413.7 | 51.71 | ||
JC James CarpenterProv |
387.3 | 55.32 | ||
MS Marc SamamaProv |
372.7 | 46.58 | ||
 Jeff CraddockProv |
368.3 | 46.04 | ||
LL Larry LandersProv |
363.6 | 48.48 | ||
CP Christian PorterProv |
351.8 | 50.26 | ||
JD Jerry "MAP" DominguezProv |
349.2 | 43.65 | ||
AG Alexander GomezProv |
339.7 | 42.46 | ||
CB Chuck BridgesProv |
333.3 | 41.66 | ||
JD James "Dingo" DominguezProv |
301.1 | 37.64 | ||
GY George YappProv |
115.1 | 16.44 | ||
JJ Joe JohnsonProv |
48.4 | 6.92 |
| # | Athlete | Match pts | Avg % | Gap |
|---|---|---|---|---|
JG James Gill |
2,192.4 | 85.12 | ||
JB Jeremy Boon |
2,045.5 | 79.27 | ||
JR Josh Ryckman |
2,044.7 | 79.68 | ||
Nic Dinsmore |
1,591.6 | 84.80 | ||
EB Eric Benoliel |
1,411.1 | 63.02 | ||
BS Brannon Sickels |
1,334.5 | 76.04 | ||
MC Matt Cunningham |
1,322.0 | 82.63 | ||
BT Bryan Tammany |
1,278.9 | 82.77 | ||
EV Eric Vela |
1,272.4 | 90.88 | ||
RC Roman Calabrese |
1,237.7 | 69.05 | ||
JM Jeff Moghadam |
1,233.7 | 67.13 | ||
MP Mike Petrone |
1,183.3 | 78.90 | ||
CG Chris Gaines |
1,159.4 | 64.46 | ||
KK Keston Kajitani |
1,154.9 | 61.18 | ||
JS Jacob Sydow |
1,126.7 | 75.11 | ||
ZW Zack Wisnowski |
1,108.4 | 73.89 | ||
DD Daniel Denton |
1,092.1 | 72.80 | ||
BY Brandon Yamasaki |
1,061.1 | 66.32 | ||
ST Steve Tanner |
1,051.5 | 54.38 | ||
CE Caleb Eadie |
1,048.1 | 72.50 | ||
SM Sean Martin |
1,037.6 | 69.17 | ||
AH Andrew Harrison |
1,028.8 | 68.84 | ||
AH Adam Hickman |
1,015.4 | 63.46 | ||
JS Jered Steck |
1,006.0 | 67.74 | ||
AM Adam Della Monica |
981.6 | 61.35 | ||
BL Brandon Libby |
942.4 | 65.19 | ||
Wil Hilderbrand |
889.9 | 58.89 | ||
MB Micah Barcus |
863.6 | 57.57 | ||
JM Jack McManus |
781.3 | 52.21 | ||
CH Christopher Hinds |
614.1 | 41.07 | ||
MG Michael Greene |
582.2 | 39.28 | ||
DP Daniel PhillipsProv |
868.8 | 78.98 | ||
MH Michael HowlettProv |
729.7 | 66.33 | ||
JJ Jacob JohnsonProv |
719.9 | 89.99 | ||
Tory KirklandProv |
712.8 | 89.10 | ||
MK Mark KramerProv |
711.9 | 64.72 | ||
MM Marc McMasterProv |
710.2 | 94.69 | ||
SG Scott GrossProv |
700.6 | 87.58 | ||
JG James GrayProv |
689.8 | 62.71 | ||
BP Benjamin PlanteProv |
674.9 | 84.36 | ||
JC Jason CapenProv |
667.6 | 83.45 | ||
RB Ryan BonesProv |
662.7 | 88.37 | ||
ID Ian DickensonProv |
655.4 | 93.62 | ||
EM E.J. McCabeProv |
647.3 | 80.91 | ||
IW Isaac WaldenProv |
642.2 | 85.63 | ||
RC Raymond ClawsonProv |
642.1 | 80.27 | ||
BE Brendan EustaceProv |
641.5 | 58.32 | ||
MA Michael AlimoProv |
641.0 | 85.47 | ||
JD Jimmy DavisProv |
640.3 | 80.04 | ||
JM Jared MundayProv |
640.3 | 58.21 | ||
BV Burke VanceProv |
639.8 | 79.98 | ||
ZT Zac TeelProv |
635.5 | 79.44 | ||
CK Cory KlemashevichProv |
634.0 | 57.64 | ||
JT Jonathan TimmProv |
631.7 | 90.25 | ||
AR Allan RiadProv |
629.3 | 78.67 | ||
KA Kyle ArpinProv |
626.1 | 83.47 | ||
ML Matt LeonardProv |
621.0 | 77.63 | ||
BS Brian ShineProv |
620.9 | 82.79 | ||
DG David GiammittorioProv |
619.1 | 88.44 | ||
JR James RutledgeProv |
617.4 | 56.13 | ||
JJ Josh JojolaProv |
614.0 | 76.76 | ||
SM Scott MackenzieProv |
613.9 | 81.85 | ||
RH Ray HopkinsProv |
612.0 | 55.64 | ||
 Paul GrossProv |
608.8 | 76.10 | ||
FG Frank GaoProv |
604.3 | 86.32 | ||
CS Christopher SumrallProv |
604.2 | 75.53 | ||
TR Tyler RobertsonProv |
597.8 | 74.72 | ||
CW Curtis WargaProv |
597.2 | 79.62 | ||
HH Hunter HamiltonProv |
595.4 | 79.38 | ||
DH Daniel HarrisonProv |
595.1 | 85.02 | ||
GB Garrett BartenProv |
594.4 | 74.30 | ||
BR Brandon RickardProv |
589.7 | 78.62 | ||
TM Tyler MartinProv |
589.3 | 73.66 | ||
JJ Josh JonesProv |
589.1 | 73.64 | ||
LL Luke LewisProv |
587.6 | 83.94 | ||
JK James KlingProv |
586.6 | 83.81 | ||
KM Kacper MindaProv |
584.5 | 83.50 | ||
MH Mw HammerProv |
578.7 | 72.33 | ||
DG Daniel GunterProv |
574.6 | 82.09 | ||
RS Ronald stefferoProv |
574.4 | 76.59 | ||
ZW Zachary WimmergrenProv |
569.6 | 75.94 | ||
DF Dan ForsmanProv |
568.3 | 75.77 | ||
TL Trey LundyProv |
567.0 | 70.87 | ||
JH Justin HoffmanProv |
563.4 | 75.13 | ||
TM Tyler MacKayProv |
562.9 | 70.36 | ||
NS Nate SchmidtProv |
561.9 | 74.92 | ||
JM John MayfieldProv |
559.3 | 69.91 | ||
BS Brandon StoweProv |
558.2 | 79.74 | ||
JN Jason NeumannProv |
556.6 | 50.60 | ||
JW Jeffrey WatsonProv |
556.3 | 69.54 | ||
HR Holden RichinsProv |
555.8 | 69.47 | ||
CM Cory McCowattProv |
555.2 | 50.47 | ||
AP Austin PhillipsProv |
555.1 | 74.01 | ||
AT Austin TurnerProv |
553.8 | 73.84 | ||
JN Justin NiemiProv |
553.1 | 79.02 | ||
JS Jake SlachciakProv |
551.7 | 73.55 | ||
JB John BlakeProv |
551.3 | 68.91 | ||
NC Nate ConlinProv |
549.7 | 73.29 | ||
JY Jake YatesProv |
549.2 | 73.23 | ||
VB Victor BrownProv |
547.2 | 72.96 | ||
MS Myles SchrageProv |
546.9 | 72.93 | ||
DD Daniel DominguezProv |
545.2 | 77.89 | ||
CW Craig WiebeProv |
544.6 | 77.80 | ||
LJ Louis JosephsProv |
544.0 | 68.00 | ||
JH Justin HellerProv |
538.2 | 71.77 | ||
MO Michael ODeaProv |
535.5 | 71.39 | ||
AF Allen FryProv |
535.2 | 66.89 | ||
HS Hunter StoreyProv |
532.2 | 66.53 | ||
SH Seth HallProv |
531.4 | 66.43 | ||
BC Bryan CarrollProv |
530.9 | 66.36 | ||
DB David BrutonProv |
528.6 | 66.07 | ||
LM Landon MarrsProv |
527.2 | 65.90 | ||
MD Matthew DriggersProv |
526.7 | 75.24 | ||
 David OrmondeProv |
525.5 | 70.07 | ||
JH Justice HoveProv |
523.5 | 47.59 | ||
BW Bob WestProv |
523.3 | 65.41 | ||
TS Taylor SermonProv |
522.5 | 65.31 | ||
NK Noah KoenigProv |
522.1 | 74.59 | ||
JP Jordan PaceProv |
521.3 | 74.47 | ||
JR Josh RoyProv |
519.6 | 69.28 | ||
PC Patrick ConlinProv |
514.4 | 68.58 | ||
DB Dylan BralyProv |
509.2 | 72.74 | ||
GS Glen SharpProv |
508.4 | 46.22 | ||
HP Humberto PenaProv |
508.0 | 63.49 | ||
JH Jacob HaroldProv |
506.8 | 63.35 | ||
ER Erik RobinsonProv |
506.7 | 63.34 | ||
GO Gabriel OrtizProv |
505.3 | 72.18 | ||
JD Justin DeKleineProv |
504.4 | 67.26 | ||
MB Matt BearceProv |
503.3 | 71.90 | ||
EH Erik HagglundProv |
502.7 | 67.03 | ||
CW Christian WindfeldProv |
502.6 | 62.82 | ||
KK Kris KlineProv |
502.5 | 67.00 | ||
JJ Jason JerusalemProv |
502.4 | 62.80 | ||
EB Evan BerryhillProv |
502.4 | 71.77 | ||
AN Alan NamazbayevProv |
499.4 | 45.40 | ||
CW Casey WalkerProv |
498.6 | 66.48 | ||
DP David PearceProv |
498.5 | 62.31 | ||
AP Anthony PatrickProv |
498.4 | 66.46 | ||
NM Nathan McCulloughProv |
494.3 | 61.78 | ||
AS Anders StrombergProv |
493.9 | 70.56 | ||
BL Big Jay listonProv |
493.7 | 61.72 | ||
SS Stefan StillProv |
493.4 | 70.48 | ||
JR Jacob RoyProv |
492.7 | 65.69 | ||
CB Cameron BayneProv |
492.1 | 44.74 | ||
TS Thomas StraubProv |
491.3 | 65.51 | ||
MG Michael GreenProv |
490.6 | 70.08 | ||
BP Bill PurdyProv |
490.2 | 70.03 | ||
JM Jeremy MeyerProv |
488.7 | 65.17 | ||
CW Craven WaldenProv |
488.6 | 65.15 | ||
KR Kyle RubisProv |
486.9 | 69.55 | ||
ST Sean TaylorProv |
483.3 | 43.93 | ||
SJ Scott JaklevichProv |
482.4 | 60.30 | ||
DL Dustin LaRosaProv |
480.6 | 68.65 | ||
JJ Joshua JojolaProv |
479.9 | 59.99 | ||
NV Nick VirbitskyProv |
479.1 | 63.88 | ||
JI Joel Willmott IIProv |
477.6 | 68.23 | ||
ED Evo DavilaProv |
477.1 | 59.63 | ||
AJ Adam JacobiProv |
474.4 | 63.26 | ||
WR Wesley RussellProv |
473.1 | 59.14 | ||
PN PJ NestlerProv |
472.3 | 67.47 | ||
VL Viet LeProv |
472.0 | 62.93 | ||
AJ Adam JungProv |
471.5 | 67.36 | ||
DS Daniel ShawProv |
470.8 | 67.26 | ||
DP Dezmond PopeProv |
469.9 | 58.74 | ||
NW Nate WilliamsProv |
468.1 | 58.51 | ||
ZH Zeke HathcockProv |
467.8 | 62.38 | ||
CM Corey McMastersProv |
466.5 | 62.20 | ||
KK Kameron KindleProv |
465.7 | 66.53 | ||
JJ Jonathan JohnsonProv |
464.5 | 66.36 | ||
JM Juan MaganaProv |
462.6 | 66.09 | ||
AH Andrew HamptonProv |
462.5 | 57.81 | ||
JA James AtkinsProv |
462.4 | 57.80 | ||
TU Tyler UgranProv |
462.2 | 61.62 | ||
BH Brennen HogenProv |
461.0 | 65.85 | ||
MM Mark MartinProv |
460.9 | 65.84 | ||
CB Cywettnie BrownProv |
460.3 | 57.53 | ||
SC Steven CroskeyProv |
458.7 | 61.15 | ||
HA Hector ArrietaProv |
458.5 | 65.49 | ||
MG Matthew GolembieskiProv |
458.3 | 61.10 | ||
MM Mike MarinoProv |
458.0 | 61.07 | ||
RB Robert BarnettProv |
456.3 | 65.18 | ||
JT Jude TeumerProv |
456.2 | 60.82 | ||
CH Cooper HurnProv |
455.9 | 60.79 | ||
CT Chase TantonProv |
455.6 | 56.95 | ||
JD Jonathan DuboisProv |
455.4 | 65.06 | ||
TM Tyler MillerProv |
454.8 | 60.64 | ||
DY Daniel YoungProv |
454.6 | 64.94 | ||
AO Austin OsbornProv |
454.6 | 64.94 | ||
TH Tyler HouldsworthProv |
453.9 | 60.52 | ||
IC Ian CrookstonProv |
453.7 | 56.71 | ||
SL Sergio LopezProv |
451.3 | 64.47 | ||
FL Fernando LopezProv |
451.2 | 64.46 | ||
RN Robert NiebuhrProv |
450.9 | 60.12 | ||
BB Bill BeveridgeProv |
449.6 | 64.23 | ||
AJ Adam jahnkeProv |
449.3 | 59.91 | ||
MG Mike GreenwoodProv |
448.6 | 59.82 | ||
DB Davin ButlerProv |
446.7 | 63.81 | ||
AS Alec SargentProv |
445.9 | 55.74 | ||
RS Ryan StephensProv |
445.8 | 63.69 | ||
AS Adam ScepaniakProv |
445.5 | 59.39 | ||
ME Marcus EguiaProv |
444.9 | 59.32 | ||
CL Carl LattingProv |
443.4 | 55.43 | ||
AD Andrei DundukouProv |
443.0 | 59.07 | ||
MA Marc AdamsonProv |
441.0 | 55.12 | ||
CH Caleb HomerProv |
439.3 | 62.76 | ||
JE Jon EvansProv |
438.3 | 58.44 | ||
DP David PulliamProv |
438.0 | 58.40 | ||
JM Jacob MorganProv |
437.9 | 54.73 | ||
TB Tim BurdickProv |
437.8 | 58.38 | ||
MS Michael StrotherProv |
436.5 | 62.36 | ||
NW Nick WalkerProv |
436.1 | 58.15 | ||
EW Elliot WilkersonProv |
435.5 | 62.21 | ||
DD David DeStefanoProv |
433.8 | 57.84 | ||
JJ Jerry Dellinger JrProv |
432.8 | 61.82 | ||
MP Marcus PippinProv |
431.4 | 53.92 | ||
RL Ryker LawrensonProv |
431.1 | 53.89 | ||
JW Jacob WeinerProv |
430.3 | 53.78 | ||
BP Brad ParcellProv |
428.3 | 57.11 | ||
JW Jeffery WatsonProv |
427.2 | 61.03 | ||
JL Jonathan LindsayProv |
426.6 | 56.88 | ||
NM Nicholas MaxinProv |
426.3 | 56.83 | ||
JM James McLanahanProv |
423.9 | 52.98 | ||
PB Parker BronsonProv |
420.1 | 56.01 | ||
SC Sean CloseProv |
419.6 | 59.95 | ||
SL Sten LiljaProv |
419.2 | 59.89 | ||
RR Robert RoseProv |
415.7 | 55.42 | ||
DT David TadlockProv |
415.5 | 59.35 | ||
AH Aaron HallProv |
414.9 | 51.86 | ||
NE Nick EvansProv |
411.7 | 54.90 | ||
MB Marcus BrittainProv |
411.4 | 51.43 | ||
TY Tim YangProv |
407.7 | 58.25 | ||
BB Brooks BensonProv |
406.9 | 50.86 | ||
RT Richard TaylorProv |
406.6 | 50.83 | ||
JW Jonathan WilkeProv |
406.0 | 54.14 | ||
AS Anthony SelvitellaProv |
405.7 | 54.09 | ||
RH Ryan HeppelProv |
405.1 | 54.01 | ||
MS Michael SisonProv |
402.5 | 50.31 | ||
KB Kyle BantzProv |
400.9 | 53.45 | ||
EI Erik Tiner IIProv |
400.3 | 53.37 | ||
SK Scott kingProv |
396.3 | 52.83 | ||
HP Harvey PottsProv |
395.5 | 52.73 | ||
PM Phil MeeksProv |
395.4 | 56.48 | ||
MB Matthew BuckProv |
393.8 | 52.50 | ||
JL Jacob LaLondeProv |
393.6 | 52.48 | ||
CN Carl NorrisProv |
393.0 | 56.14 | ||
CJ Cameron JeffersProv |
392.8 | 49.09 | ||
ES Eugene SmithProv |
392.5 | 56.07 | ||
FB Frank BullockProv |
389.8 | 51.97 | ||
RH Randy HouckProv |
389.5 | 55.64 | ||
GC Gregory ComstockProv |
389.3 | 51.90 | ||
ZH Zachary HoberProv |
388.1 | 55.44 | ||
MM Michael MedinaProv |
387.6 | 55.37 | ||
MC Matthew CantrellProv |
386.3 | 48.29 | ||
GB Glenn BennettProv |
385.3 | 55.04 | ||
GO Gregory O'BrienProv |
384.8 | 48.10 | ||
JV Jeremey VasquezProv |
383.0 | 51.06 | ||
VA Vincent AstrinoProv |
382.7 | 54.68 | ||
MV Matthew VentrisProv |
380.0 | 47.50 | ||
TB Tyler BauerProv |
377.6 | 50.35 | ||
IE Ian EichelmanProv |
376.6 | 50.21 | ||
SD Shannon DunsonProv |
376.4 | 53.77 | ||
AP Antonios PanagiotakisProv |
375.8 | 50.11 | ||
TP Tam PhamProv |
375.5 | 53.64 | ||
JW Jeffrey WaytProv |
375.2 | 46.90 | ||
JD Jerry DellingerProv |
373.7 | 46.72 | ||
JH Justin HanceProv |
369.9 | 46.23 | ||
RM Ryan MayProv |
365.4 | 45.68 | ||
BS Brian ShaefferProv |
362.6 | 51.80 | ||
LG Lex GalangProv |
361.2 | 48.16 | ||
SD Seth DohertyProv |
361.2 | 51.59 | ||
RC Randall CookProv |
360.8 | 48.11 | ||
RH Randy HillProv |
355.3 | 47.37 | ||
VR Victor RodriguezProv |
348.5 | 46.46 | ||
JF Justin FuchsProv |
345.2 | 43.15 | ||
SJ Sebastian JonesProv |
344.3 | 43.04 | ||
JS Jeff SangalangProv |
340.6 | 42.58 | ||
IS Isaiah SmithProv |
340.1 | 42.51 | ||
SM Scott MinderleinProv |
337.5 | 45.00 | ||
CS Carl StuffProv |
330.5 | 41.32 | ||
DB Drew BryantProv |
326.4 | 40.79 | ||
KO Kramer OlmstedProv |
317.3 | 39.66 | ||
CB Cullen BrungsProv |
313.1 | 44.72 | ||
AW Anthony WestberryProv |
304.1 | 38.01 | ||
RH Robert HefleyProv |
296.0 | 42.29 | ||
MP Mark PetersenProv |
296.0 | 39.46 | ||
JG Jon-Michael GOMEZProv |
295.5 | 36.94 | ||
TG Tim GarciaProv |
286.5 | 26.04 | ||
CG Cesar GarciaProv |
282.2 | 40.31 | ||
SC Sean CashProv |
275.6 | 39.37 | ||
AD Adam DriscollProv |
266.3 | 35.51 | ||
EG Ethan GanzyProv |
256.9 | 36.70 | ||
JE Jesse EvansProv |
254.3 | 31.79 | ||
MB Michael ButlerProv |
252.7 | 33.70 | ||
PM Philip McHaleProv |
238.3 | 29.78 | ||
AC Angel CunananProv |
215.9 | 30.84 | ||
ND Nicholas DeanProv |
208.0 | 26.00 | ||
GR Grant RandallProv |
204.4 | 29.19 | ||
BY Britton YoungstromProv |
189.9 | 23.74 | ||
BD Barry DenhamProv |
180.7 | 22.59 | ||
MR Matthew RobertsProv |
109.5 | 14.60 | ||
SB Seth BurnesProv |
89.4 | 11.92 | ||
JS Javvad SyedProv |
77.7 | 11.10 | ||
PM Paul McCraryProv |
72.8 | 9.70 | ||
JL Jimmy LuongProv |
60.0 | 8.57 | ||
TA Trent AllsupProv |
28.3 | 2.57 |
| # | Athlete | Match pts | Avg % | Gap |
|---|---|---|---|---|
TG Tina Garcia |
2,591.0 | 85.36 | ||
MS Mandy Stanford |
2,271.5 | 86.97 | ||
MF Marlania Fraser |
1,909.8 | 86.78 | ||
FF Faith Ford |
1,380.0 | 73.19 | ||
HH Hannah Heichen |
1,230.7 | 81.80 | ||
KP Katie Pimentel |
1,128.3 | 75.06 | ||
KH Kimberly Herron |
1,091.9 | 75.37 | ||
ED Elizabeth Dini |
1,038.7 | 56.12 | ||
VH Victoria Harrison |
1,025.9 | 69.04 | ||
JH Jo-Lynn Hatley |
887.6 | 55.48 | ||
RC Raelle Cunningham |
684.6 | 42.79 | ||
MT Maddie TurnerProv |
1,054.4 | 95.85 | ||
AT Ashley TylerProv |
948.7 | 86.24 | ||
EB Elisa BoydProv |
850.1 | 77.28 | ||
LJ Lisa JasterProv |
840.9 | 76.45 | ||
MT Mikenzie TerryProv |
753.2 | 94.15 | ||
AG Amanda GlennProv |
706.2 | 88.28 | ||
ML Megan LeitchProv |
704.2 | 93.89 | ||
BR Bryanna RuddickProv |
695.3 | 86.91 | ||
SP Sandra PollardProv |
675.7 | 61.43 | ||
Katie BatisteProv |
662.9 | 88.39 | ||
JB Jessica BoltonProv |
639.8 | 85.31 | ||
MB Maryanna BarcusProv |
636.5 | 84.86 | ||
RN Rachel NuziardProv |
605.9 | 75.73 | ||
LB Leticia BustamanteProv |
601.4 | 85.92 | ||
RT Rebecca TurrellProv |
597.0 | 79.60 | ||
Becky WagnerProv |
593.7 | 79.16 | ||
LH Laci HathcockProv |
586.5 | 78.20 | ||
MH Madison HansenProv |
583.0 | 83.29 | ||
KR Kate RebelloProv |
582.0 | 72.75 | ||
VC Vanessa ChavezProv |
562.2 | 80.31 | ||
CC Collyn CurrieProv |
558.7 | 69.84 | ||
CW Cheyenne WaldenProv |
551.6 | 73.54 | ||
KD Keelin DarbyProv |
550.3 | 78.61 | ||
EC Elizabeth CoxProv |
538.8 | 71.84 | ||
AY Alison YeakeyProv |
534.7 | 76.38 | ||
NC Nancy ColeProv |
529.0 | 66.13 | ||
LL Lauren LongfieldProv |
526.0 | 70.14 | ||
JA Jenna ArriesgadoProv |
520.1 | 69.35 | ||
CH Christina Van Der HulstProv |
517.1 | 73.87 | ||
SG Shea GravesProv |
515.2 | 64.40 | ||
TM Tiffany MorganProv |
513.3 | 73.33 | ||
CS Christine SydowProv |
513.2 | 68.43 | ||
BC Brandi CameronProv |
504.5 | 72.06 | ||
BF Briana FaroniProv |
500.9 | 62.62 | ||
JR Jeanine RenyProv |
498.6 | 71.23 | ||
LC Lauren CollinsProv |
483.2 | 60.40 | ||
MP Megan PavaoProv |
482.1 | 64.28 | ||
CB Courtney BoeckmanProv |
480.0 | 68.58 | ||
AF Aletheia FadnessProv |
473.8 | 59.22 | ||
EG Elizabeth GuffeyProv |
471.9 | 62.91 | ||
HG Hayley GoodsteinProv |
468.1 | 66.88 | ||
LJ Layal JabbourProv |
457.5 | 65.36 | ||
CA Chelsea AngelosantoProv |
453.2 | 60.42 | ||
CG Cassandra GeilProv |
446.1 | 55.76 | ||
MA Michele AikinProv |
437.5 | 54.69 | ||
KU Kelly UrwilerProv |
433.0 | 54.12 | ||
PM Paul McCraryProv |
431.7 | 61.67 | ||
CT Charlotte TeunisseProv |
426.7 | 53.33 | ||
KC Kimberly ClowdusProv |
419.9 | 59.98 | ||
BH Beverlee HawkinsProv |
410.1 | 58.59 | ||
MM Marcela MendozaProv |
408.0 | 51.00 | ||
SR Stephanie RosarioProv |
390.9 | 48.86 | ||
GC Glenda CraddockProv |
387.4 | 48.43 | ||
EG Elizabeth GehrmannProv |
379.2 | 47.40 | ||
LP Lacie PetschProv |
370.1 | 52.86 | ||
KH Kelsee HoberProv |
339.4 | 48.49 | ||
NK Naomi KomisarjevskyProv |
232.1 | 30.94 |
Match pts: total match points across events in this division and scope. The 2023 season ran no points purse; the total is tracked for reference and nothing rides on it. Avg % of possible: average of each event's score as a share of the points available, each event weighted equally; ranked once the athlete meets the series' event minimum, provisional until then. Rank by switches which metric orders the board; both columns always show. Gap: behind the leader in the active metric. Archived season: final boards, no movement column. How scoring works →